By the Financial Markets Research Team · 12 min · Updated 2025
Technical analysis is the study of price and volume data to inform trading decisions. It does not predict the future; it organizes the present. Mastered with discipline, it becomes a structured language for describing what markets are doing — useful both for trade selection and for evaluating the platforms on which trades are executed.
Charts and time frames
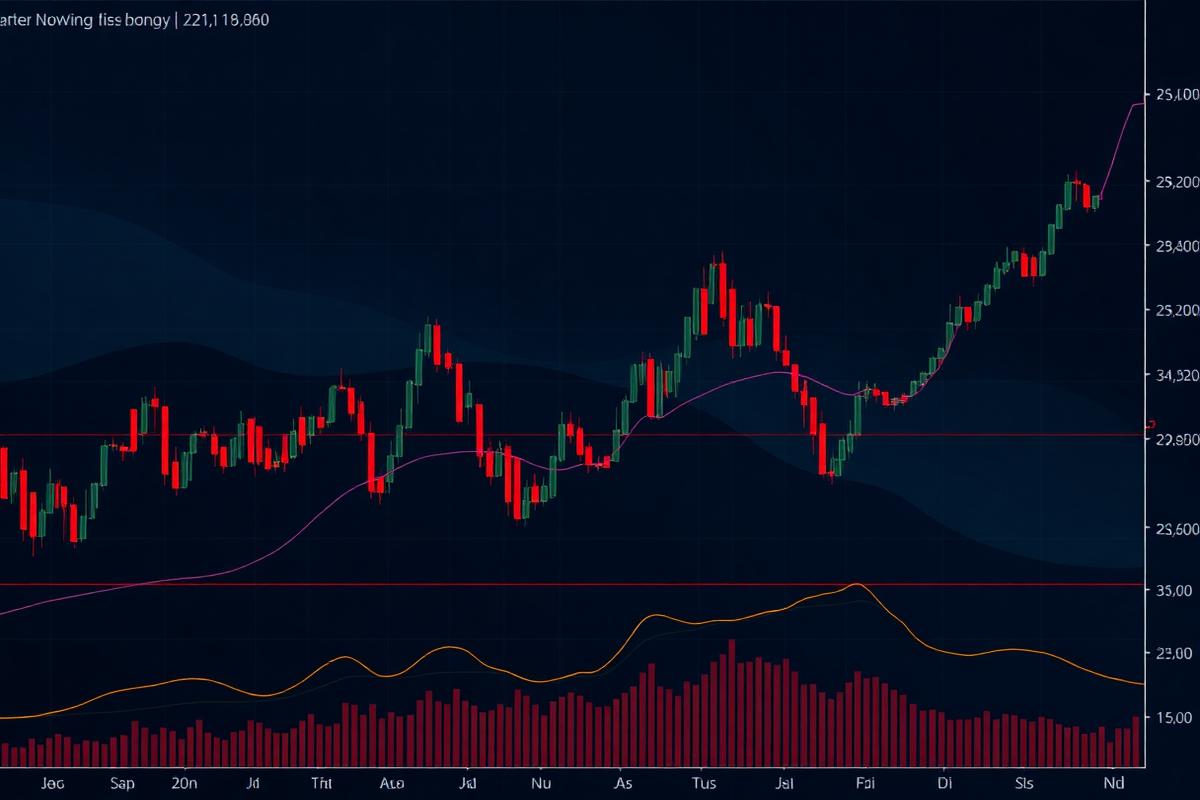
The candlestick chart is the most widely used visual representation of price. Each candle summarizes the open, high, low and close of a period. Higher time frames reveal structure; lower time frames reveal noise. Skilled analysts often use multiple time frames — the higher to define context, the lower to refine entry timing.
Support, resistance and structure
Support and resistance are price regions where the market has historically reversed or paused. They are not lines but zones, and their reliability tends to fade as they are repeatedly tested. Market structure — the sequence of higher highs and higher lows, or lower highs and lower lows — is a more durable framing.
Indicators
Indicators are mathematical transformations of price or volume. The most common families include:
- Trend indicators — moving averages, MACD.
- Momentum indicators — RSI, stochastic oscillator.
- Volatility indicators — Bollinger Bands, ATR.
- Volume indicators — OBV, volume profile.
Indicators are derived from price. They cannot reveal information that price itself does not contain. Their value is in summarization, not prediction.
Patterns
Classical chart patterns — head and shoulders, double tops, triangles, flags — describe recurring market behaviors. Their forecasting power is debated, but they remain useful as structured ways to talk about price action.
Why analysis depends on platform quality
The cleanest analytical framework is undermined by unreliable charting, slow data feeds or inconsistent pricing. This is why our reviews — including the Blumberg-Global platform review — pay close attention to the quality of charting tools and data presentation.
Pairing technical analysis with risk control
Even an accurate read on a chart will not produce a profitable account without disciplined risk management. Readers should pair this article with our risk management guide and our broader discussion of how platforms work.
Educational disclaimer: This article is for educational purposes only and does not constitute financial advice.